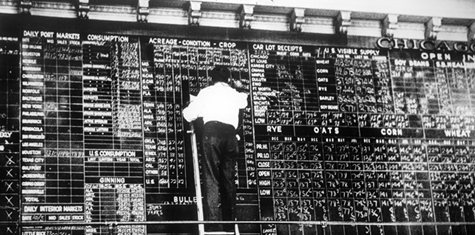
From the viewpoint of a 40+ year futures, options, and cash commodity trader and onetime floor scalping trader.
Back when I was a floor trader on the Minneapolis Exchange (now the CME) there was only the day session. There was no globex session so at the end of the trading day we would look in the crystal ball and attempt to figure what the market may do tomorrow using technical analysis. We would re-evaluate our plans an hour or two before the morning open as fundamental news overnight may be important.
- At the end of our current session we would take the day’s high, low, and close of the day and plot on our chart for the next day.
- We would add the prices of the high, low, and close and then divide by three and plot this number on the chart …. This was known as the Floor Trader Pivot or simply the Pivot.
- We would also look at the high/low range of the past four and seven days.
So how did we look at these three points to forecast tomorrow
- If the close was in the middle of range of the today’s session tomorrow may be a consolidation day with a sideways choppy up and down market with no direction. If the day’s close was in the upper 10% of the day’s range our bias would be to possibly see a move beyond the present day high and possibly a gap move to a higher resistance (sell) zone. Same would be the case if the close was in the lower 10% of the range with an expected move to a lower support (buy) zone beyond the low of our current session.
- The floor trader pivot was used by the floor trader to decide whether to buy first and sell second or vice-versa. The pivot was an indicator that said if the market is above the pivot most momentum of the market will be up therefore being a floor trader and scalper of one, two, or three ticks if the market jumped we wanted to be on the side of momentum.
- The high/low range of the current session was compared to the daily ranges of the last four and seven days that included the current days
session. If the current sessions range was narrower than the last four or the last seven, we would be expecting an exciting day in the following session. This is known as NR4 and NR7 (narrow range 4 and narrow range 7) volatility signs.
